Let a machine read AutoCAD drawings into a list of members and a quotation: the money comes from three sources, each one can be measured in your own company, and the ROI still holds when the assumptions are lowered.
What is reading a drawing by machine worth?
All it needs is bids per month, manual takeoff hours per bid, and the share of drawings the machine can actually read. Every money figure follows from those three — and every one is editable.
Derived from the three numbers above
Assumptions — click to see and change every number
People and labour
Wins from quoting faster
Under-measured quantities
Investment
This is an estimate, not a promise. Line B is the softest — set it to zero and read the total again. Then set the share of readable drawings to zero: every line goes to zero with it, because a drawing the machine cannot read saves nothing.
In structural steel, pre-engineered buildings and construction fabrication, the slowest step before a contract is not on the shop floor. It is on the estimator's desk: open the AutoCAD drawing, count every column, rafter, purlin, brace and plate, then key all of it into Excel to look up weights and apply prices.
This piece works out the ROI of letting a machine do that part — read the .dwg/.dxf drawing into
a list of members, show the model in the browser, and build the quotation from the cost data already
in the ERP. The money comes from three places: estimator hours, contracts won by quoting faster, and
under-measured quantities that stop happening. For each one, the piece shows how to calculate it, how
to measure it in your own company, and how far to trust it.
1. What takeoff costs today
The familiar process has four steps: receive the drawing from the owner or the design consultant;
the estimator measures and counts with DIST, MEASURE, DATAEXTRACTION or by eye; key it all
into Excel, looking up the unit weight of every section, the paint area, the galvanising area; then
hand the file to sales and accounting to apply material, labour, transport and erection rates.
Its cost sits in three places, and none of them shows up in any report.
- Hours. A 5,000–10,000 m² factory building takes 3 to 7 working days of one or two estimators. At 25 bids a month, this step eats the whole time of more than two people.
- Speed. A competitor who submits first has already given the owner a number to compare against. A bid that arrives a few days late enters the comparison at a disadvantage.
- Errors. Counting hundreds of members and thousands of connection details by hand means things get missed: a bracing system, the paint area of the plates, a steel grade. Under-measure and the company absorbs the loss during construction. Over-measure and the bid is too high and lost.
This is also the shape that the piece on customer-specific templates met at the output end: an important document rebuilt by hand from data that already sits somewhere. Here, the data sits in the drawing.
2. What the change is
Not a CAD package inside the ERP. Three steps, chained.
- Read the drawing into a list of members. The parser reads layers, attributed blocks and the steel schedule tables in the file, recognises the member type, section (I, H, C, Z, angle, box), length, count and grade, and writes them straight into a list in the ERP.
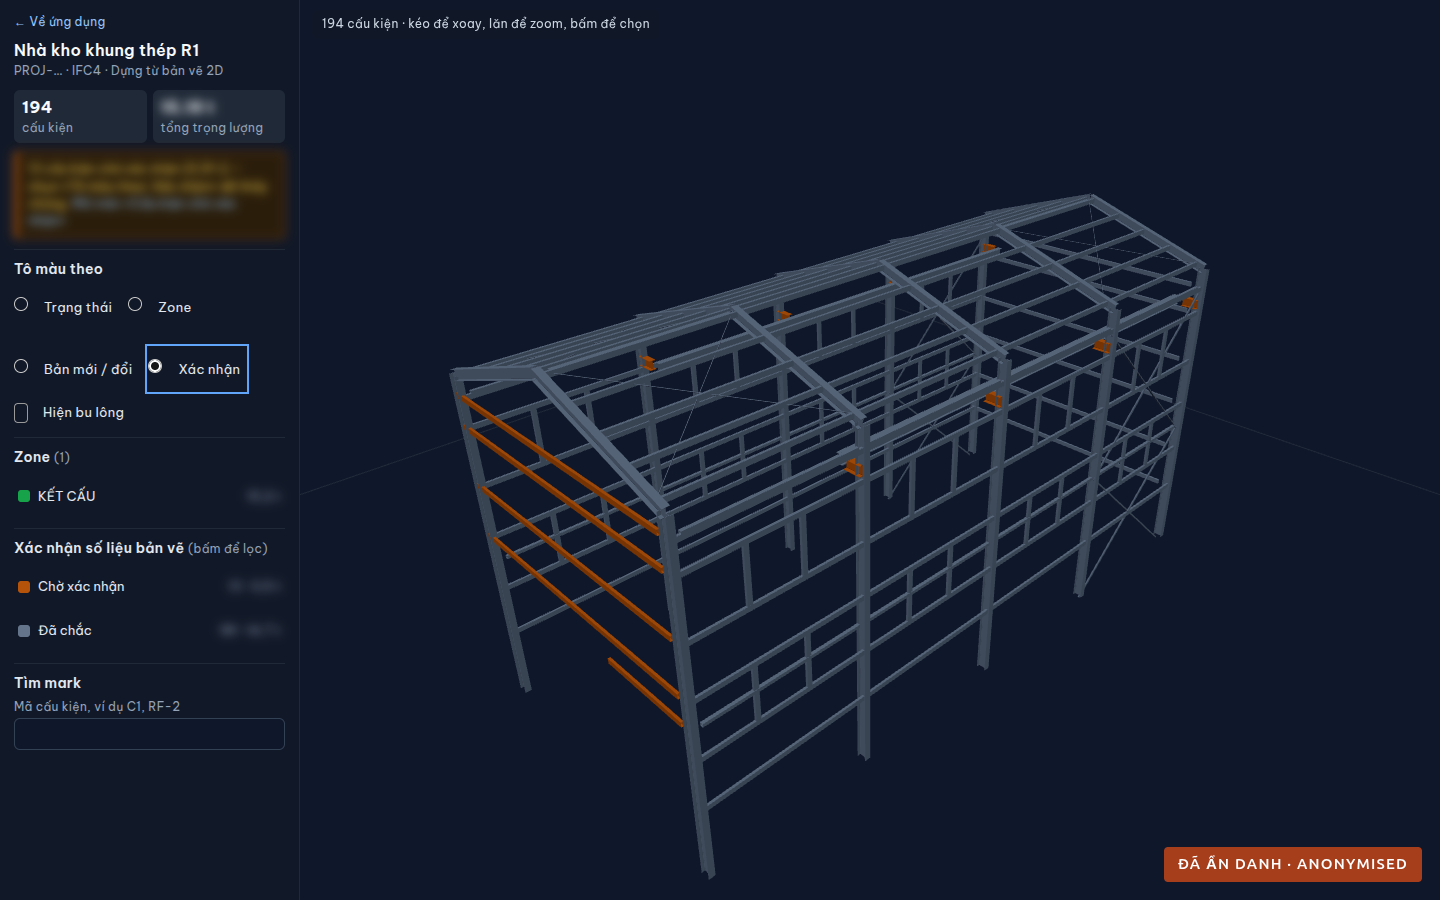
- See the model in the browser. Click a row — say
Rafter K1— and exactly that member lights up on the model. Checking the whole drawing becomes running down the rows. - Build the quotation from the costs already in the system. Weight × current steel price, surface area × paint or galvanising rate, fabrication labour per tonne, plus fittings, anchor bolts, transport, craneage.
The machine reads the drawing in minutes; what remains is the engineer checking the places the machine is unsure of — about two hours a bid. The quotation goes out the same day instead of days later.
3. The first source of money: estimator hours
How to measure it. Both ends of the formula can be timed with a stopwatch: three bids measured by hand, then three read by machine plus the review time. Three on each side is enough to tell whether the figure sits near 10 hours or near 20 — and that is the difference that decides it.
The share of drawings the machine can read is the factor most easily overlooked. Drawings from design consultants sometimes arrive with their blocks exploded into loose lines, layers named however the draughtsman liked, or the steel schedule as plain text; for those, the estimator still measures from scratch. Measure it with the last 20 drawing sets you received: run them through the machine and count how many produce a quantity sheet within a few percent of the hand-measured one. The calculator defaults to 100% — the most optimistic case — and this factor multiplies into all three sources of money.
When hours become money. As the piece on keyboard shortcuts put it, freed hours only become money when they go into something that has a price: less overtime, not hiring when volume grows, or time moved onto the difficult drawings the machine cannot read. If the company spends those hours quoting more bids, the benefit shows up as extra contracts — it is not added here a second time.
4. The second source: quoting faster, winning more contracts
This line is credited to speed of response on the same bids, not to quoting more of them — the hours are already counted in the first source.
How to measure it. The bid register usually already holds the data: the date the drawing arrived, the date the quotation went out, won or lost. Work out the win rate by response time — under two days, two to five days, over five days — for the 12 months before the change. If fast replies do not win more often than slow ones, this line is close to zero in your company.
How far to trust it: the least of the three. A contract is won for many reasons, and nobody can separate out the part that came from speed. Set it to zero and read the total again — if the change is only worth making because of this line, it is not yet worth making.
5. The third source: fewer under-measured quantities
How to measure it. For each completed project, compare the quantities in the quotation with the quantities actually shipped from the shop. A positive gap is under-measurement; multiplied by the unit price, it is money already lost. Two years of data is usually enough to see your own company's rate and typical loss — no need to borrow anyone else's figures.
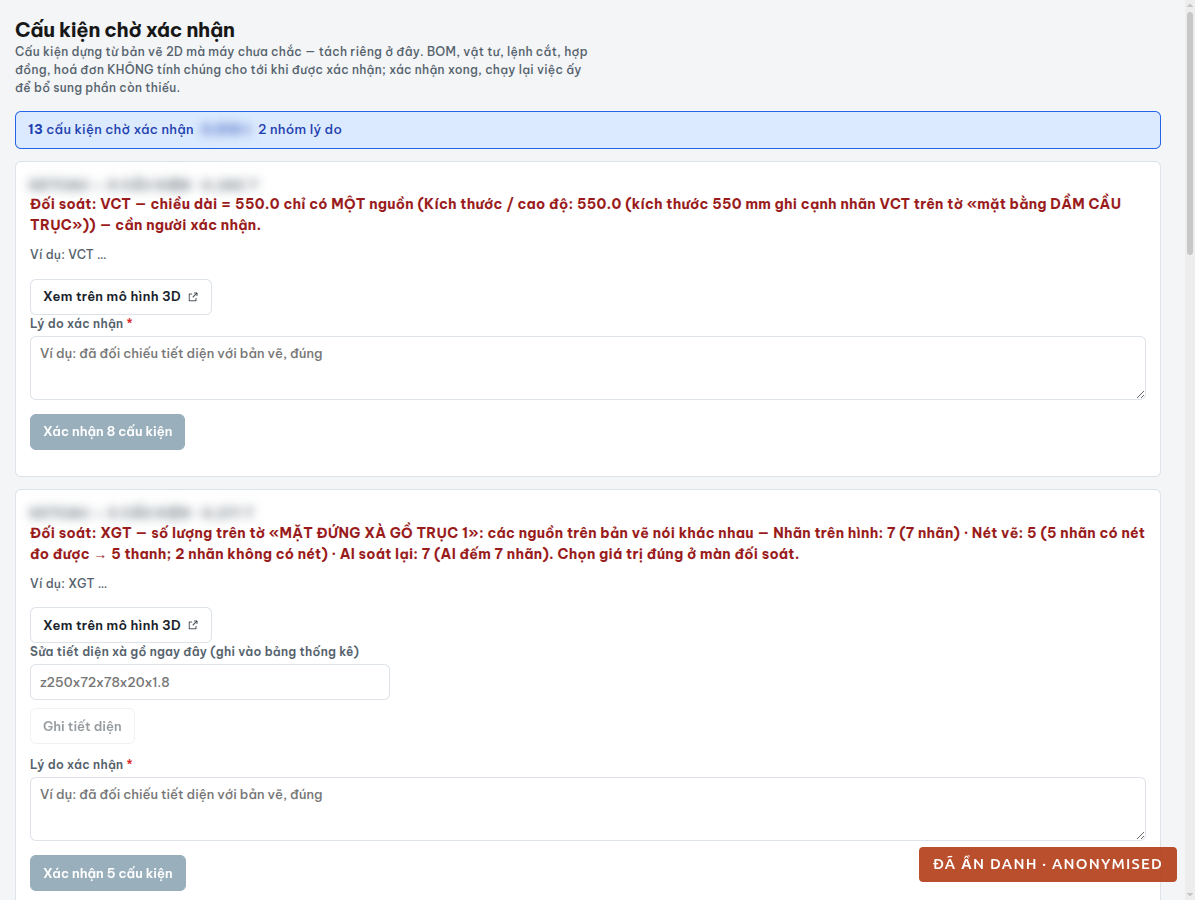
The 3D model and the confirmation screen do not make this risk disappear; they reduce it, on the drawings the machine can read, and only if somebody actually looks at the model before the price is signed.
6. Adding it up
With the default assumptions in the calculator above, and a one-off investment of 150 million:
| Source | Per month | Per year |
|---|---|---|
| Estimator hours | 35.7 M | 428.4 M |
| Extra wins from quoting faster | 22.3 M | 267.3 M |
| Fewer under-measured jobs | 8.3 M | 99.0 M |
| Total, against a 150 M investment | 66.2 M | payback ~2.3 months |
The first-year return on the investment is about 430%. More than half comes from the firmest source — hours — and the softest line accounts for about a third.
7. What this ROI stands on
The tornado chart in the calculator moves each assumption up to one and a half times and down to half, holding the rest. At the default figures:
- The longest bar is manual hours per bid: on its own it moves the total from about 550 million to over 1 billion a year.
- Second is the share of drawings the machine can read.
- The "extra wins" line — the hardest to prove — is not the one that decides it.
The good news is that the two that matter most can both be measured in a week, before a single dong is spent. And even when several assumptions are lowered at once, the calculation still stands:
- Only 60% of drawings readable: 476.8 million a year, payback 3.8 months.
- No extra wins counted: 527.4 million a year, payback 3.4 months.
- Both, and review takes 4 hours instead of 2: 279.7 million a year, payback 6.4 months.
Even the most pessimistic case pays back within the first year. That is the number to take into the investment meeting, not 430%.
8. Measuring it in your own company
Three steps, and the first has to happen before the change goes live — without a baseline there is no ROI.
- Take a baseline (four weeks). For every bid, record three numbers: takeoff hours, the date the drawing arrived, the date the quotation went out. Pull from the records of the previous 12 months: the win rate by response time, and the gap between quoted and actually shipped quantities on completed projects.
- Pilot on 20 drawing sets. Measure the share the machine can read and the actual review time. These two numbers replace the calculator's two biggest assumptions.
- Measure again after three months, against your own baseline. Compare like with like — factory buildings with factory buildings, multi-storey with multi-storey — so that the bidding season or one unusually large project is not mistaken for a result of the change.
The first source will be clear after three months. The second and third need one to two years of bids to show — so do not make them a condition of approving the investment; track them as a bonus.
9. What to take away
A drawing is the engineer's language; a quotation is the language of money. Between the two, in most companies, sits a person retyping. This change does not replace that person — it removes the retyping, and leaves them the part the machine cannot do: reading the bad drawings, and checking the good ones.
A trustworthy ROI is not the biggest number you can calculate, but the one that still stands once the assumptions are lowered — and that you can measure in your own company.
The figures in this piece are illustrative, for a structural steel business producing 300–500 tonnes a month; they are not taken from any client's system. Replace them with your own in the calculator above.